SOL Price Prediction: Analyzing the Bull Case Amidst Current Market Pressure

#SOL
- Critical Technical Juncture: SOL is testing major support at the $124.87 lower Bollinger Band. A hold here could stabilize the price, while a break may trigger a sharper decline.
- Contrasting Market Signals: Bearish short-term technical indicators (price below MA, negative MACD) are juxtaposed with bullish long-term fundamentals (new platform integrations).
- High-Risk, High-Reward Profile: Current levels offer a potential accumulation zone for long-term believers in Solana's ecosystem, but require tolerance for near-term volatility and downside risk.
SOL Price Prediction
Technical Analysis: SOL Tests Critical Support Levels
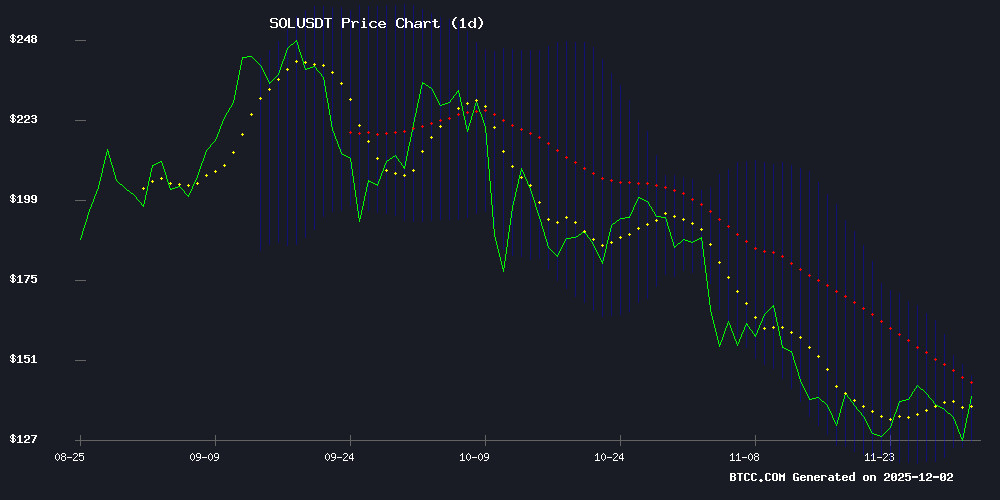
According to BTCC financial analyst Sophia, SOL is currently trading at $126.75, which is below its 20-day moving average of $135.55. This suggests a short-term bearish momentum. The MACD indicator shows a negative histogram value of -4.96, indicating that bearish momentum may be strengthening in the NEAR term. However, the price is hovering just above the lower Bollinger Band at $124.87, which often acts as a dynamic support level. A sustained hold above this band could signal a potential reversal, while a break below might lead to further declines toward the $120 psychological level.
Market Sentiment: Integration News Contrasts with Price Pressure
BTCC financial analyst Sophia notes that recent headlines present a mixed picture for Solana. The integration of Kalshi's tokenized prediction markets via DFlow is a fundamental positive, highlighting Solana's utility and adoption in decentralized finance. However, price prediction articles focusing on the critical $130 support level and questioning 'How High' SOL can rise reflect underlying market caution. The sentiment appears cautiously optimistic on long-term prospects but acknowledges immediate technical headwinds, aligning with the technical analysis that shows the asset is under pressure.
Factors Influencing SOL’s Price
Kalshi Integrates Tokenized Prediction Markets with Solana via DFlow
Kalshi, a CFTC-regulated prediction market exchange, has launched tokenized versions of its markets on Solana through an integration with DFlow and Jupiter. This marks the first time federally regulated event contracts are available on blockchain infrastructure.
The DFlow Prediction Markets API enables developers to access Kalshi markets as SPL tokens on Solana, allowing prediction market positions to be traded, borrowed, lent, or used as collateral in DeFi protocols. Kalshi is supporting the ecosystem with a $2 million grants program for builders.
Jupiter, Solana's largest decentralized exchange aggregator, will route trades through these tokenized markets, potentially exposing millions of users to prediction market trading. "Tokenization is the endgame," Kalshi stated, emphasizing the non-custodial and composable nature of the integration.
Solana Price Prediction: SOL Tests Critical Support at $130 Amid Liquidity and Pattern Signals
Solana's price hovers near $130, a pivotal support zone that could dictate its next major move. The cryptocurrency, currently trading at $129.28, reflects a 4.97% decline over the past 24 hours. Market participants are closely watching whether this level holds, as it has historically served as a springboard for upward momentum.
Liquidity clusters between $130 and $150 suggest strong market interest, with $130 acting as a magnet for price action. Analysts note that Solana's ability to maintain above this threshold could pave the way for a rally toward $150–$165. The wedge patterns and high-timeframe market structure further bolster the bullish case, provided demand persists.
Brave New Coin data underscores Solana's position slightly below mid-range levels but above key weekly support. The density of resting orders in the $130–$150 range, highlighted by liquidity maps, indicates potential for significant price rotation. Solana's resilience in this zone may determine whether it revisits lower liquidity pockets or ascends toward higher targets.
How High Can Solana (SOL) Rise in December 2025?
Solana (SOL) enters the final stretch of 2025 with traders scrutinizing its momentum as the asset struggles to maintain upward traction. Despite a 10.32% decline in 24-hour performance, the token shows resilience at $125.66—an 8.8% intraday rebound—with $70.28 billion in market capitalization underscoring its heavyweight status.
Technical charts reveal a critical resistance at $128.45, where a breakout could propel SOL toward $132. Conversely, failure to hold the $125.05 support level risks a retreat to $120. The oversold RSI at 25.59 signals panic selling, while the Stochastic Momentum Index confirms bearish dominance—a contrarian setup that may attract accumulation at these levels.
Is SOL a good investment?
Based on the current technical and fundamental data, SOL presents a high-risk, high-potential-reward investment scenario at this moment.
Short-term (1-4 weeks): The technical picture is challenging. Trading below the key moving average and with bearish MACD signals suggests the price may test or break the $124.87 support. Investors should be prepared for potential volatility and further downside.
Medium to Long-term (3+ months): The fundamental news is constructive. Integrations like Kalshi's use of Solana demonstrate real-world utility and network growth, which are positive drivers for value over time. If the price finds a solid base at or near current levels, it could set the stage for a recovery.
Key Data Snapshot:
| Metric | Value | Interpretation |
|---|---|---|
| Current Price | $126.75 | Below key MA, indicating bearish trend |
| 20-Day MA | $135.55 | Immediate resistance level |
| Bollinger Band (Lower) | $124.87 | Critical short-term support |
| MACD Histogram | -4.96 | Bearish momentum is present |
In conclusion, for risk-tolerant investors with a longer time horizon, accumulating SOL near the lower Bollinger Band could be a strategic entry point, betting on the strength of its ecosystem developments. For conservative investors, it may be prudent to wait for a clearer bullish reversal signal, such as a reclaim of the 20-day MA.
